In the American political scene, Oregon is considered a blue state. Oregon has voted for Democratic U.S. presidential candidates in every election since 1988, and numerous polls indicate that this trend will continue in 2024. This leads the Superstitious Statistician to ask, ‘How blue is Oregon?’ I am also left to wonder just how long Oregon has been blue.
Let’s investigate.
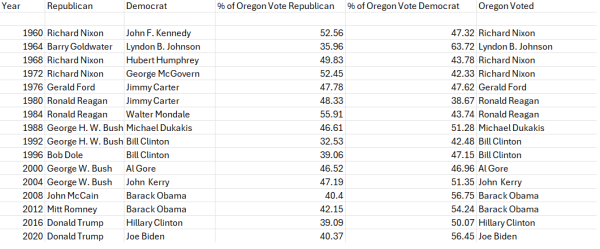
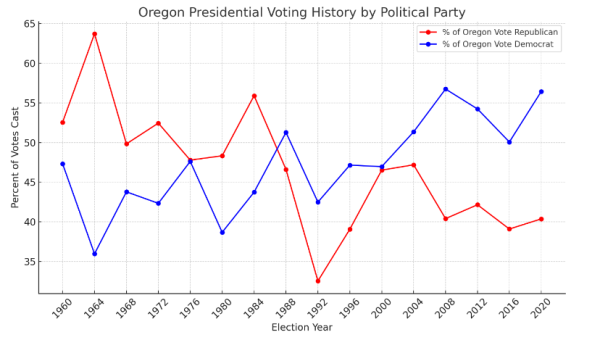
We can gain context for Oregon’s democratic lean by examining presidential elections since 1960. This reveals a fascinating reversal of trends, as between 1960 and 1988, Oregon only voted for a Democratic candidate one time (when voters picked Lyndon Johnson over Barry Goldwater). It seems like a fact from an alternate universe that Oregonians voted for Richard Nixon three times, let alone that they picked him over John F. Kennedy.
Below are Oregon’s Presidential election results since 1960.
Even more bizarre, Oregonians never voted for Jimmy Carter, casting their ballots for Gerald Ford in 1976 and Ronald Reagan in 1980. Oregon’s current reputation for liberalism is far cry from its mid-20th century electoral proclivities. In fact, the margins by which Republican presidential candidates won Oregon between 1960 and 1988 were a mirror image of the margins by which Democrats have won in Oregon since 1988.
The average Republican margin of victory in Oregon between 1960 and 1988 was 7.2%. The average Democratic margin of victory between 1988 and 2020 was 9.2%. Based on the numbers, Oregon was as red between 1960 and 1988 as it is blue today.
If we dive a little deeper into the data and look at the graph below, we see that between 1976 and 2000, Oregon voted Republican three times and Democrat four times. The elections in 1976 and 2000 were especially close, with Ford defeating Carter 47.78% to 47.62% in 1976 and Gore defeating George W. Bush 46.96% to 46.52% in 2000. The average margin of victory for the winning party in this timeframe was 6.44%.
Somewhere along the way, Oregon flipped from red to blue. Why?
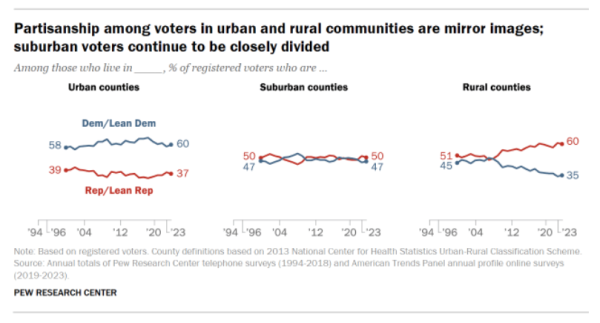
A plausible explanation is that Oregon’s population has grown disproportionately in urban areas. Citizens living in large cities are more likely to vote Democrat than Republican. According to research obtained from Pew Research Center’s “Changing Partisan Coalitions in a Politically Divided Nation,” citizens living in urban areas are far more likely to be Democrats, and those living in rural areas are far more likely to be Republicans.
Political party affiliation for urban, suburban and rural communities. Source: Pew Research Center.
If we consider Oregon’s changes in demographics, then it just might be the case that growth in urban counties flipped Oregon from Republican to Democrat. According to data collected from Oregon.gov, the population in Oregon’s five most populous counties has grown from 1.53 million in 1980 to 2.61 million in 2020, a growth of 70.33%. The population in all other Oregon counties has grown from 1.1 million in 1980 to 1.66 million in 2020, a growth of 50.73%.
That Oregon is likely to vote for Democratic presidential candidates is not a claim that is going to surprise many Americans, nor Oregonians. Given the state’s current penchant for voting for Democrats, learning that Oregon voted for Richard Nixon three times just might. In observing historical voting trends, analyzing the geographic dispersion of political party affiliation and calculating Oregon’s greater growth in its largest, more liberal urban agglomerations, we are better able to understand not just how blue Oregon is, but how this ‘blueness’ may have come to be.






























![Newspaper clipping from February 25, 1970 in the Daily Barometer showing an article written by Bob Allen, past Barometer Editor. This article was written to spotlight both the student body’s lack of participation with student government at the time in conjunction with their class representatives response. [It’s important to note ASOSU was not structured identically to today’s standards, likely having a president on behalf of each class work together as one entity as opposed to one president representing all classes.]](https://dailybaro.orangemedianetwork.com/wp-content/uploads/2025/03/Screenshot-2025-03-12-1.00.42-PM-e1741811160853.png)

