Editor’s note: This is a column and does not reflect the views or opinions of the Daily Barometer.
Presidential candidates frequently boast that they will be great for the United States economy, all the while voters deliberate their votes.
Understanding the relationship between political policy and market performance is imperative for investors and economists, especially as administrations change like they are right now.
By understanding past data, economists and investors aim to set policies that work for the American people. In analyzing stock market data since 1953, we see the performance of the market during different presidential administrations to answer the question.
Via analysis in statistical software, using data from Yahoo Finance, I found that stock market returns during Democratic presidencies exceeded those under Republican administrations. 
Logarithmic returns are used here because it helps keep the returns to scale and is a common practice in displaying historical returns. The average daily return under Democratic presidents is almost double that of Republicans. The stock market is also slightly less volatile under Democratic presidents.
We can see the performance of the market under different administrations below:
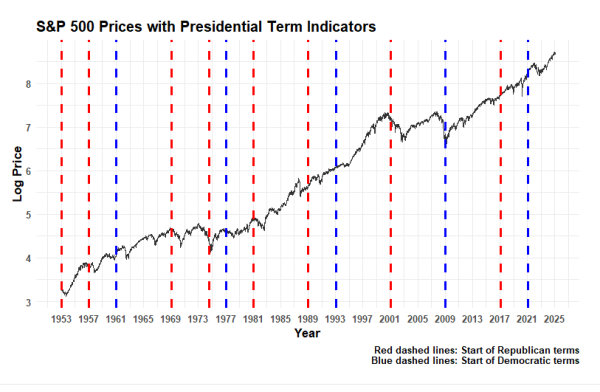
But, we should take this with a grain of salt: With 12 Republican presidential terms and 11 Democratic ones, this is a relatively small sample size of presidencies.
Oregon State University economics professor Michael Nelson sees other complications too:
“Stock market movements are determined by so many factors that it’s basically impossible to pin down which factors are causing stock market fluctuations,” Nelson said. “When we think about the policy impacts of particular presidents, we need to recognize that there are almost always delays between policy implementation and policy outcomes.”
Additionally, some policies take longer than others to affect the U.S. economy, according to Nelson. This makes dissecting the role that the White House plays in the stock market even harder.
“Government policies are only a part, and sometimes a small part, of the reason that financial markets and economies fluctuate. Ultimately it’s usually very challenging to show evidence that a particular policy had a discernible economic impact,” Nelson said.
According to a 2022 study titled “Does the U.S. president affect the stock market?” published in the Journal of Financial Markets, Republican administrations have been associated with divided governments: 83% of the time compared to 38% for Democrats.
The study found that divided governments reflect economic uncertainty among traders and lead to lower returns. That Republican presidents have more frequently faced divided governments may explain the lower returns, according to the study.
As for volatility, research from Professor Bryan Routledge of Carnegie Mellon University also investigated the volatility of the stock market between 1953 and 2022 corroborating results.
“The average volatility is similar across Democratic and Republican administrations (13.0% versus 13.4% – a negligible difference),” the research stated.
The results from my analysis agree with other sources: the political party of the president doesn’t appear to have much effect on the stock market.
But what explains the fact that returns under Democratic presidents are nearly double those of Republicans?
According to Routledge, it may simply be two events: the first is the Dotcom Bubble, which grew under Clinton and burst under Bush; the second is the 2008 financial crisis in which the stock market collapsed at the end of George W. Bush’s presidency and recovered at the beginning of Barack Obama’s.
Historical data shows that stock markets have performed well under both parties, driven by general economic trends rather than specific policies, and perhaps all of this analysis only goes to show that there may be no difference made at all by the party in the White House.






![Newspaper clipping from February 25, 1970 in the Daily Barometer showing an article written by Bob Allen, past Barometer Editor. This article was written to spotlight both the student body’s lack of participation with student government at the time in conjunction with their class representatives response. [It’s important to note ASOSU was not structured identically to today’s standards, likely having a president on behalf of each class work together as one entity as opposed to one president representing all classes.]](https://dailybaro.orangemedianetwork.com/wp-content/uploads/2025/03/Screenshot-2025-03-12-1.00.42-PM-e1741811160853.png)


